Research commentary
Is the “K-Shaped Economy” as Bad as It Seems?
Headlines say the haves and have-nots have split into a K. The data — on inflation, spending, income, and sentiment — says the gap is far narrower than the narrative.
- +82%S&P 500 total return, Dec 2020 – Dec 2025
- +35%Lowest wage quartile cumulative growth, 2019–2025
- +28%5-year shelter inflation, Dec 2020 – Dec 2025
The short answer is no. Since the pandemic, headlines have touted the gap between the haves and have-nots — high- versus low-income consumers. The popular narrative is that prices have risen markedly since the pandemic and, as a result, lower-income consumers have been forced to be more restrained as food, shelter, and energy costs eat into disposable income.
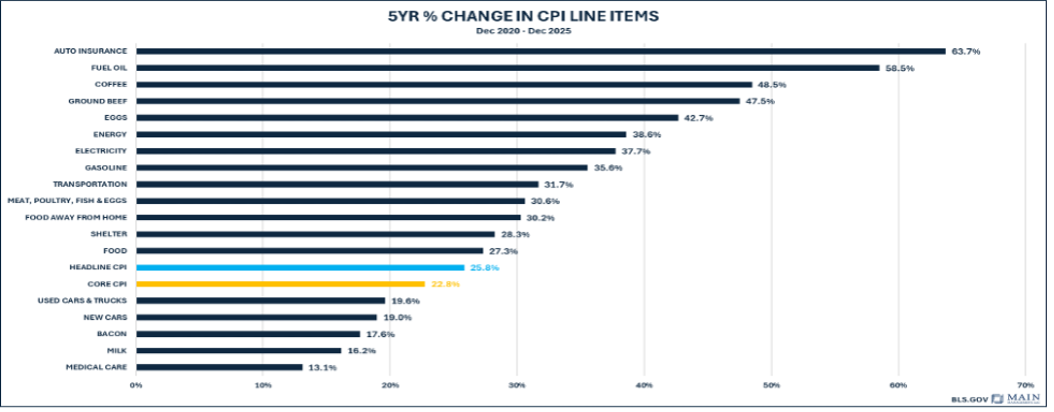
General food prices are up +27% over the last five years. Electricity and gas are up 36–37%. Shelter is up +28%. Over that same period (Dec 2020 – Dec 2025), the S&P 500 is up a very strong +82%.
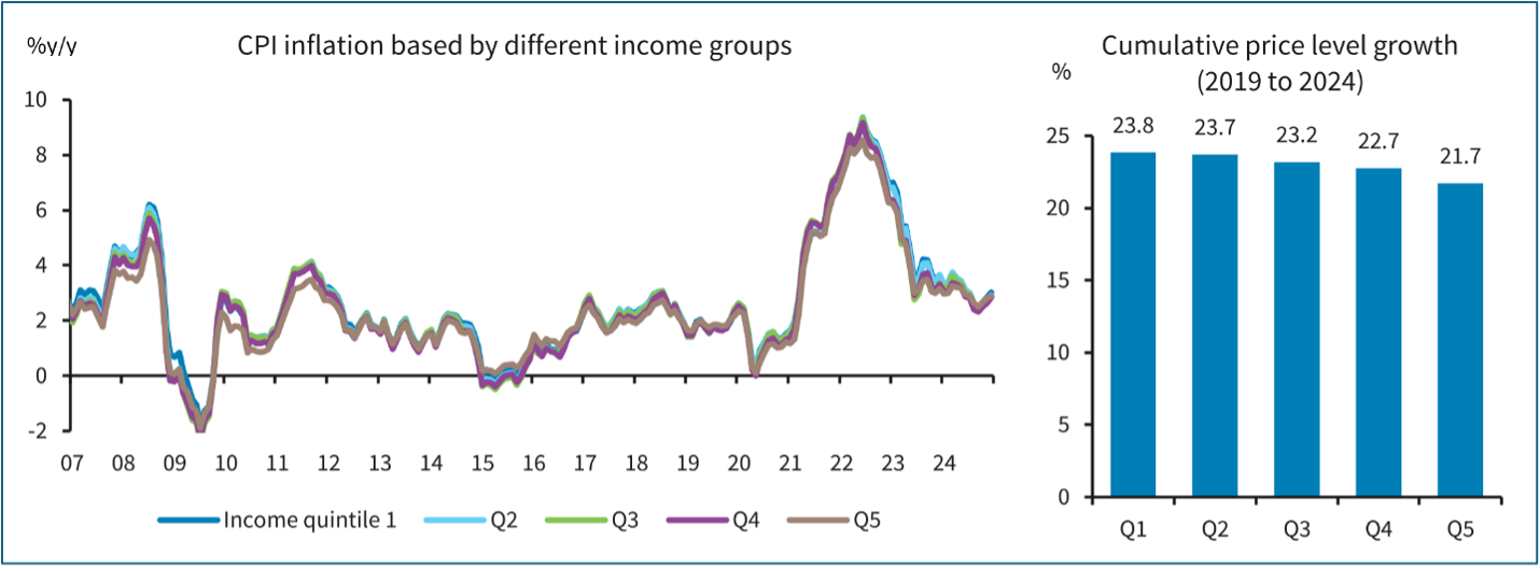
Inflation by income: a 2% gap, nothing outlandish
The lower-income quintile did experience larger price increases relative to higher-income quintiles — but only by about 2% more. Real, but hardly the chasm the headlines imply.
The top 10% does not actually account for half of all consumer spending
One cited discrepancy is that lower-income consumers have not participated in equity gains to the same extent as higher-income consumers, who own a disproportionate share of equities. Some outlets have even claimed half of all spending comes from the top 10% of earners. Looking at the breakdown of personal consumption expenditures, that doesn’t appear to be the case: the higher-income quintile accounts for roughly 35% of PCE and the bottom quintile accounts for 11%. The key observation is that the levels are fairly static — they have not swung to the degree the narrative would have you believe, and if anything the top quintile’s consumption share has fallen slightly, not risen.
Lower-income spending has kept pace with higher-income groups
The NY Fed’s Survey of Consumer Expectations shows spending by lower-income groups has kept pace with that of higher-income groups, and lower earners are not planning to cut back any more than others.
Income growth has not been as disparate as the narrative would have you believe
Nominal disposable personal income growth is up +15.3% for the top income quintile compared with +14.1% for the bottom quintile (2019–2024) — not a huge discrepancy. The Atlanta Fed shows the lowest wage quartile has seen the biggest cumulative wage growth from 2019 to 2025.
Confidence is actually higher at the lower end of the income spectrum
Both earnings/income and spending for the lower-income groups have largely kept pace with — if not outpaced — those metrics for higher-income groups. And this shows up in sentiment: lower-income groups are no more pessimistic than higher-income groups. In fact, consumer confidence is higher at the lower end of the income spectrum.
The takeaway
The K-shaped economy is likely not nearly as pronounced as the media would have you believe. That’s good news — people across the income spectrum are experiencing gains in wages, income, and assets, and are planning to continue spending.
For advisors, the opportunity isn’t reacting to headlines — it’s positioning portfolios with a disciplined, research-driven framework that accounts for that underlying resilience. This kind of work — translating macro research into portfolio positioning — is at the core of how we partner with advisors through our Custom Model Partnerships. We co-create custom models that align an advisor’s preferred managers with our institutional, research-driven, risk-aware asset-allocation framework. The goal isn’t to replace an advisor’s process, but to institutionalize and enhance it.
- 01LearnWe start by fully understanding your business and clients.
- 02BuildWe co-create custom model portfolios through an iterative partnership.
- 03ImplementThe best model is the one you're comfortable with.
- 04PartnerOngoing reviews, market commentary, and practice-management support.
All metrics from Morningstar Direct, Macrobond, and FactSet Financial Data and Analytics. This material is for informational purposes only and does not constitute investment advice or a recommendation to buy or sell any security. It reflects the opinion of Main Management as of the date written and is subject to change. All investing involves risk, including the possible loss of principal. Past performance does not guarantee future results.